Wednesday, 31 May 2017
Diving Giraffes
WALT: Use Compound and complex sentences correctly
This week we are lean to use compound and complex sentences
Friday, 26 May 2017
FUN THREE DAYS
(Wednesday)
On Wednesday my group muniches had art this is what i did it says KEEP CALM & STAY LIT FIFITA

(Thursday)
On Thursday we made was an awesome day for the year 7's. You may wonder why today was a awesome day, because we were spilt into our tahi, Rua and Toru group. I'm in the Toru group, Our 3nd activity was cooking. The Ingredient we need was, 1 pack of super wine biscuit, 1 whole can of condensed milk, 1/4 cup of coca, 3/4 cup of choc chip and the last ingredient was 1 cup of desiccated coconut. But first we had to get into 4 groups. Each group had to put all the ingredient into a bowl, then you form a small circle, covering it with coconut. Then we put them in the refrigerator.
2. sift 1/4 cup of cocoa into a bowl

On Wednesday my group muniches had art this is what i did it says KEEP CALM & STAY LIT FIFITA

(Thursday)
On Thursday we made was an awesome day for the year 7's. You may wonder why today was a awesome day, because we were spilt into our tahi, Rua and Toru group. I'm in the Toru group, Our 3nd activity was cooking. The Ingredient we need was, 1 pack of super wine biscuit, 1 whole can of condensed milk, 1/4 cup of coca, 3/4 cup of choc chip and the last ingredient was 1 cup of desiccated coconut. But first we had to get into 4 groups. Each group had to put all the ingredient into a bowl, then you form a small circle, covering it with coconut. Then we put them in the refrigerator.
1. Crush your packet of super wine biscuit - they don't need to be fine crumbs.
2. sift 1/4 cup of cocoa into a bowl
3. gently mix the super wine biscuit and cocoa together
4. add 3/4 cup of choc ships
5. Add 1 cup of desiccated Coconut
6. gently mix together
7. Pour in whole can of condensed milk ( Mix as you go )
8. make small truffle balls then roll it on a plate f dedicated coconut
9. Store in fridge overnight
10. pack truffle balls into cellophane bags and tie it up with a ribbon.

(Friday)
Today we have to do a blog post about what we did
Tuesday, 23 May 2017
Discussing Data
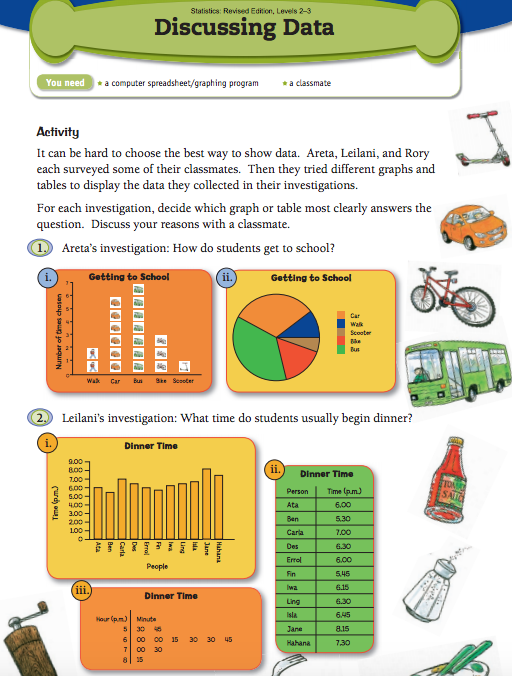
1. Two people walk 6 kids go in the car 7 kids go on the bus 3 kids bike and 1 goes on the scooters.

2. 8:15 and 7:30
1. There’s a bar graph , pie graph , tally chart
2. When you use a pie graph for how many girls or boys are in a class you don't know many girl or boys are in the class. A bar graph can see how many boy and girl are there from the numbers on the side.
3. Bar graph and tally chart

Friday, 12 May 2017
Statistics AWS L2
- How many student play Volleyball ? 12
2. 17 Pupils played which sport ? soccer
3.How many student played hockey ? 19
4. How many more student played ruby then netball ? 32
5. Which sport is played by the most number of student ? 32
6. How many Student walk to school ? 70
7. How many student come by car ? 40
8. How many student bike to school ? 23
9. How many Student come by bus and train ? 22
10. How many more student come by car then bus ? 40
11 . How would you work out how many student go to this school ? 155
12. In Linda’s class there are 15 girls and 14 boys draw a table to show information .
Remember to write a heading for each column of your table .
Girls
|
Boys
|
15
|
14
|
13. In Tracy’s class there were 2 student away on Monday 4 away on Tuesday none away on Wednesday 3 away on Thursday and 2 away student away on Friday.
Draw a table to show the information Remember to write a heading for each column of your table .
How many student were away
|
How many student were at school
|
11
|
4
|
Wednesday, 10 May 2017
Tuesday, 9 May 2017
Thursday, 4 May 2017
Choice squares
Why do think Mr Winita drew a question mark ?
I think that the answers is apple because on the bar graph
Which three graph/Chart are shown?
- Pie Chart, Bar Graph and Pictograph

Each student chose one of the fruits or the ? and drew it on a blank choice square.
- Jo collected all these choice squares to display the results.
Which graph do you think most clearly shows in Room 8 Favourite fruit? (Explain why)
- Bar graph. I chose this graph/chart because it shows how much fruit there are, What type of fruit it is and shows the title of what the graph is showing.
Subscribe to:
Posts (Atom)