| WALT: How to gather and display category and simple whole-number data - interpret displays in context This week we are learning to gather and display category and simple number data interpret displays in context and number data |
Showing posts with label 2017 Assignment maths Team Five Mrs Judd. Show all posts
Showing posts with label 2017 Assignment maths Team Five Mrs Judd. Show all posts
Thursday, 15 June 2017
Statistical

Tenths
\
| WALT - Identify and uses tenths to make numbers This weeks task was to focus and identify the uses of tenths to make numbers, We compared fractions and decimals and how we could change one to the other. |
Tuesday, 23 May 2017
Discussing Data
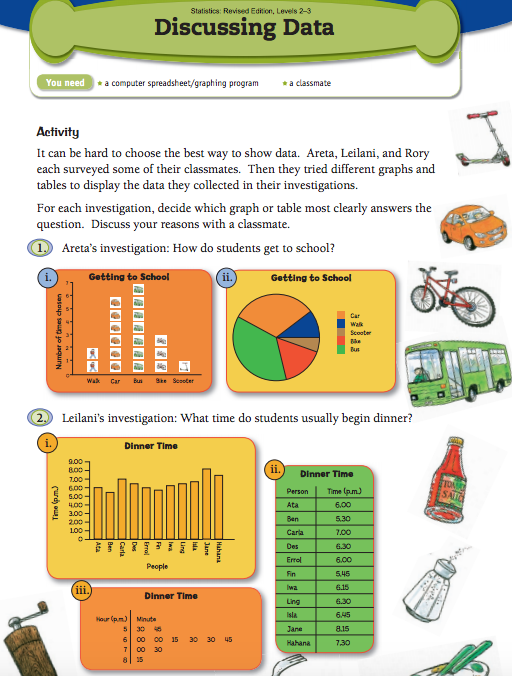
1. Two people walk 6 kids go in the car 7 kids go on the bus 3 kids bike and 1 goes on the scooters.

2. 8:15 and 7:30
1. There’s a bar graph , pie graph , tally chart
2. When you use a pie graph for how many girls or boys are in a class you don't know many girl or boys are in the class. A bar graph can see how many boy and girl are there from the numbers on the side.
3. Bar graph and tally chart

Wednesday, 10 May 2017
Wednesday, 8 March 2017
Tuesday, 21 February 2017
Subscribe to:
Posts (Atom)